[解決済み] フォースディレクションレイアウトに新しいノードを追加する
質問
Stack Overflowでの最初の質問、だから私に我慢して!私はd3.jsの初心者です。私はd3.jsに新しいですが、他の人がそれで達成できることに常に驚いています...そして、私自身がそれでどれだけ前進していないかにほぼ同様に驚いています!私は明らかに何かを理解していないので、ここの親切な魂が私に光を与えてくれることを願っています。明らかに私は何かを理解していないので、ここの親切な魂が私に光を示してくれることを望みます。
私の意図は、単に次のことを行う再利用可能なjavascript関数を作成することです。
- 指定された DOM 要素に空白の力動グラフを作成します。
- そのグラフにラベル付けされた、画像を持つノードを追加、削除することができ、それらの間の接続を指定することができます。
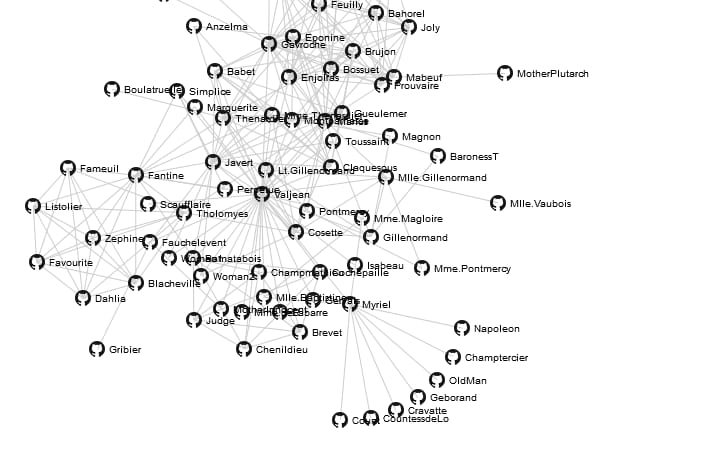
私は http://bl.ocks.org/950642 を出発点として、本質的にこのようなレイアウトを作成できるようにしたいからです。
私のコードはこんな感じです。
<!DOCTYPE html>
<html>
<head>
    <script type="text/javascript" src="jquery.min.js"></script>
    <script type="text/javascript" src="underscore-min.js"></script>
    <script type="text/javascript" src="d3.v2.min.js"></script>
    <style type="text/css">
        .link { stroke: #ccc; }
        .nodetext { pointer-events: none; font: 10px sans-serif; }
        body { width:100%; height:100%; margin:none; padding:none; }
        #graph { width:500px;height:500px; border:3px solid black;border-radius:12px; margin:auto; }
    </style>
</head>
<body>
<div id="graph"></div>
</body>
<script type="text/javascript">

function myGraph(el) {

    // Initialise the graph object
    var graph = this.graph = {
        "nodes":[{"name":"Cause"},{"name":"Effect"}],
        "links":[{"source":0,"target":1}]
    };

    // Add and remove elements on the graph object
    this.addNode = function (name) {
        graph["nodes"].push({"name":name});
        update();
    }

    this.removeNode = function (name) {
        graph["nodes"] = _.filter(graph["nodes"], function(node) {return (node["name"] != name)});
        graph["links"] = _.filter(graph["links"], function(link) {return ((link["source"]["name"] != name)&&(link["target"]["name"] != name))});
        update();
    }

    var findNode = function (name) {
        for (var i in graph["nodes"]) if (graph["nodes"][i]["name"] === name) return graph["nodes"][i];
    }

    this.addLink = function (source, target) {
        graph["links"].push({"source":findNode(source),"target":findNode(target)});
        update();
    }

    // set up the D3 visualisation in the specified element
    var w = $(el).innerWidth(),
        h = $(el).innerHeight();

    var vis = d3.select(el).append("svg:svg")
        .attr("width", w)
        .attr("height", h);

    var force = d3.layout.force()
        .nodes(graph.nodes)
        .links(graph.links)
        .gravity(.05)
        .distance(100)
        .charge(-100)
        .size([w, h]);

    var update = function () {

        var link = vis.selectAll("line.link")
            .data(graph.links);

        link.enter().insert("line")
            .attr("class", "link")
            .attr("x1", function(d) { return d.source.x; })
            .attr("y1", function(d) { return d.source.y; })
            .attr("x2", function(d) { return d.target.x; })
            .attr("y2", function(d) { return d.target.y; });

        link.exit().remove();

        var node = vis.selectAll("g.node")
            .data(graph.nodes);

        node.enter().append("g")
            .attr("class", "node")
            .call(force.drag);

        node.append("image")
            .attr("class", "circle")
            .attr("xlink:href", "https://d3nwyuy0nl342s.cloudfront.net/images/icons/public.png")
            .attr("x", "-8px")
            .attr("y", "-8px")
            .attr("width", "16px")
            .attr("height", "16px");

        node.append("text")
            .attr("class", "nodetext")
            .attr("dx", 12)
            .attr("dy", ".35em")
            .text(function(d) { return d.name });

        node.exit().remove();

        force.on("tick", function() {
          link.attr("x1", function(d) { return d.source.x; })
              .attr("y1", function(d) { return d.source.y; })
              .attr("x2", function(d) { return d.target.x; })
              .attr("y2", function(d) { return d.target.y; });

          node.attr("transform", function(d) { return "translate(" + d.x + "," + d.y + ")"; });
        });

        // Restart the force layout.
        force
          .nodes(graph.nodes)
          .links(graph.links)
          .start();
    }

    // Make it all go
    update();
}

graph = new myGraph("#graph");

// These are the sort of commands I want to be able to give the object.
graph.addNode("A");
graph.addNode("B");
graph.addLink("A", "B");

</script>
</html>
新しいノードを追加するたびに、既存のノードすべてにラベルが付け直されます。これらは互いに積み重なり、物事は醜くなり始めます。これがなぜなのか、私は理解しています。
update()
関数を呼び出すと、新しいノードを追加する際に
node.append(...)
をデータセット全体に適用します。に対してこれを行う方法がわかりません。
を追加しているノードのみ
... そして、私は明らかに
node.enter()
を使用して1つの新しい要素を作成することしかできないので、ノードにバインドする必要がある追加の要素には機能しません。どのように私はこれを修正することができますか?
この問題のいずれかに与えることができる任意のガイダンスに感謝します!
以前言及された他のいくつかのバグのソースをすぐに修正したため、編集されました。
どのように解決するのですか?
これを動作させることができないまま何時間も経過した後、私は最終的に、どのドキュメントにもリンクされていないと思われるデモを偶然発見しました。 http://bl.ocks.org/1095795 :
このデモには、最終的に問題を解決するための鍵が含まれていました。
複数のオブジェクトを
enter()
を割り当てることで、複数のオブジェクトを追加することができます。
enter()
を変数に代入し、それに追加する。これは理にかなっている。第二の重要な部分は、ノードとリンクの配列が
force()
-- そうでなければ、ノードが削除されたり追加されたりして、グラフとモデルが同期されなくなります。
これは、もし新しい配列が代わりに構築された場合、次のようなものが欠けてしまうからです。 属性 :
- index - ノード配列内のノードの 0 から始まるインデックスです。
- x - 現在のノードの位置の x 座標です。
- y - 現在のノード位置の y 座標です。
- px - 直前のノードの位置の x 座標です。
- py - 直前のノードの位置の y 座標です。
- fixed - ノード位置がロックされているかどうかを示す boolean です。
- weight - ノードの重み、関連するリンクの数です。
これらの属性は,厳密には,呼び出しのために必要ではない
force.nodes()
を呼び出すのに必要なものではありませんが、これらが存在しない場合、それらは
ランダムに
で初期化されます。
force.start()
で初期化されます。
もし誰かが好奇心旺盛なら、作業コードは次のようになります。
<script type="text/javascript">

function myGraph(el) {

    // Add and remove elements on the graph object
    this.addNode = function (id) {
        nodes.push({"id":id});
        update();
    }

    this.removeNode = function (id) {
        var i = 0;
        var n = findNode(id);
        while (i < links.length) {
            if ((links[i]['source'] === n)||(links[i]['target'] == n)) links.splice(i,1);
            else i++;
        }
        var index = findNodeIndex(id);
        if(index !== undefined) {
            nodes.splice(index, 1);
            update();
        }
    }

    this.addLink = function (sourceId, targetId) {
        var sourceNode = findNode(sourceId);
        var targetNode = findNode(targetId);

        if((sourceNode !== undefined) && (targetNode !== undefined)) {
            links.push({"source": sourceNode, "target": targetNode});
            update();
        }
    }

    var findNode = function (id) {
        for (var i=0; i < nodes.length; i++) {
            if (nodes[i].id === id)
                return nodes[i]
        };
    }

    var findNodeIndex = function (id) {
        for (var i=0; i < nodes.length; i++) {
            if (nodes[i].id === id)
                return i
        };
    }

    // set up the D3 visualisation in the specified element
    var w = $(el).innerWidth(),
        h = $(el).innerHeight();

    var vis = this.vis = d3.select(el).append("svg:svg")
        .attr("width", w)
        .attr("height", h);

    var force = d3.layout.force()
        .gravity(.05)
        .distance(100)
        .charge(-100)
        .size([w, h]);

    var nodes = force.nodes(),
        links = force.links();

    var update = function () {

        var link = vis.selectAll("line.link")
            .data(links, function(d) { return d.source.id + "-" + d.target.id; });

        link.enter().insert("line")
            .attr("class", "link");

        link.exit().remove();

        var node = vis.selectAll("g.node")
            .data(nodes, function(d) { return d.id;});

        var nodeEnter = node.enter().append("g")
            .attr("class", "node")
            .call(force.drag);

        nodeEnter.append("image")
            .attr("class", "circle")
            .attr("xlink:href", "https://d3nwyuy0nl342s.cloudfront.net/images/icons/public.png")
            .attr("x", "-8px")
            .attr("y", "-8px")
            .attr("width", "16px")
            .attr("height", "16px");

        nodeEnter.append("text")
            .attr("class", "nodetext")
            .attr("dx", 12)
            .attr("dy", ".35em")
            .text(function(d) {return d.id});

        node.exit().remove();

        force.on("tick", function() {
          link.attr("x1", function(d) { return d.source.x; })
              .attr("y1", function(d) { return d.source.y; })
              .attr("x2", function(d) { return d.target.x; })
              .attr("y2", function(d) { return d.target.y; });

          node.attr("transform", function(d) { return "translate(" + d.x + "," + d.y + ")"; });
        });

        // Restart the force layout.
        force.start();
    }

    // Make it all go
    update();
}

graph = new myGraph("#graph");

// You can do this from the console as much as you like...
graph.addNode("Cause");
graph.addNode("Effect");
graph.addLink("Cause", "Effect");
graph.addNode("A");
graph.addNode("B");
graph.addLink("A", "B");

</script>
関連
-
[解決済み] URLを新しいタブで開く(新しいウィンドウではない)
-
[解決済み] JavaScriptで配列の先頭に新しい配列要素を追加するにはどうすればよいですか?
-
[解決済み] JavaScriptの「new」キーワードとは何ですか?
-
[解決済み] JavaScript で範囲を作成する - 奇妙な構文
-
[解決済み] <Enter>でjQuery UIダイアログを送信する
-
[解決済み] Node.jsでbase64エンコードされた画像をAmazon S3へアップロードする
-
[解決済み] 兄弟ノードを選択する方法はありますか?
-
[解決済み] Javascriptで動的に命名されたメソッドを呼び出すにはどうすればよいですか?
-
[解決済み] JavaScript で `throw` の後に `return` をする必要がありますか?
-
[解決済み] Fetch: ステータスがOKでない場合、プロミスを拒否し、エラーをキャッチするか?
最新
-
nginxです。[emerg] 0.0.0.0:80 への bind() に失敗しました (98: アドレスは既に使用中です)
-
htmlページでギリシャ文字を使うには
-
ピュアhtml+cssでの要素読み込み効果
-
純粋なhtml + cssで五輪を実現するサンプルコード
-
ナビゲーションバー・ドロップダウンメニューのHTML+CSSサンプルコード
-
タイピング効果を実現するピュアhtml+css
-
htmlの選択ボックスのプレースホルダー作成に関する質問
-
html css3 伸縮しない 画像表示効果
-
トップナビゲーションバーメニュー作成用HTML+CSS
-
html+css 実装 サイバーパンク風ボタン
おすすめ
-
[解決済み] JavaScript で範囲を作成する - 奇妙な構文
-
[解決済み] Javascriptによるタッチスクリーンデバイスの検出
-
[解決済み] ExtJS 4のイベントハンドリングについて
-
[解決済み] TypeScriptのdeclare classとinterfaceの違いとは?
-
[解決済み] Javascript 空の配列の削減
-
[解決済み] jQueryで入力ファイルが空かどうかをチェックする方法
-
[解決済み] JavaScriptで長い配列を小さい配列に分割する方法
-
[解決済み] Node.jsのES6クラスをrequireで作る
-
[解決済み] なぜjavascriptのES6 Promisesはresolve後も実行を継続するのですか?
-
[解決済み] リダイレクトされずにHTMLフォームを送信する方法