[解決済み】「LinearSegmentedColormap」を別の色分布に変更するには?
2022-02-13 02:34:16
質問
低い値を「優先」するカラーマップを作ろうとしています。つまり、暗い色から明るい色になるまでに時間がかかるのです。今のところ、これをカラーマップとして使っています。
cmap = clr.LinearSegmentedColormap.from_list('custom blue', ['#ffff00','#002266'], N=256)
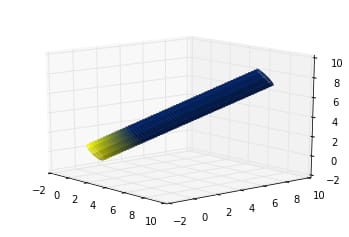
効果を見るために円柱の周りにプロットしています(記事の最後にある円柱のコードを参照)、このコードを実行するとこうなります。
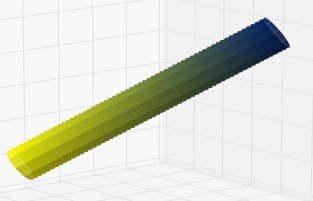
見ての通り、これは非常に「直線的」です。円筒の半分くらいから色が変化し始めます。色が急激に変化し始めるときのしきい値を大きくする方法はないでしょうか?例えば、非常に大きな数字だけが最も明るいレベルの黄色になるようにしたいのです。ありがとうございます。
from matplotlib import cm
from matplotlib import pyplot as plt
from mpl_toolkits.mplot3d import Axes3D
from scipy.linalg import norm
from mpl_toolkits.mplot3d.art3d import Poly3DCollection
import numpy as np
import math
import mpl_toolkits.mplot3d.art3d as art3d
import matplotlib.colors as clr


fig = plt.figure()
ax = fig.add_subplot(111, projection='3d')


origin = [0,0,0]
#radius = R
p0 = np.array(origin)
p1 = np.array([8, 8, 8])
origin = np.array(origin)
R = 1

#vector in direction of axis
v = p1 - p0
#find magnitude of vector
mag = norm(v)
#unit vector in direction of axis
v = v / mag
#make some vector not in the same direction as v
not_v = np.array([1, 0, 0])
if (v == not_v).all():
not_v = np.array([0, 1, 0])
#make vector perpendicular to v
n1 = np.cross(v, not_v)
#normalize n1
n1 /= norm(n1)
#make unit vector perpendicular to v and n1
n2 = np.cross(v, n1)
#surface ranges over t from 0 to length of axis and 0 to 2*pi
t = np.linspace(0, mag, 600)
theta = np.linspace(0, 2 * np.pi, 100)
#use meshgrid to make 2d arrays
t, theta = np.meshgrid(t, theta)
#generate coordinates for surface
X, Y, Z = [p0[i] + v[i] * t + R * np.sin(theta) * n1[i] + R * np.cos(theta) *     n2[i] for i in [0, 1, 2]]

#THIS IS WHERE THE COLOR MAP IS

cmap = clr.LinearSegmentedColormap.from_list('custom blue',     ['#ffff00','#002266'], N=256)
col1 = cmap(np.linspace(0,1,600)) # linear gradient along the t-axis
col1 = np.repeat(col1[np.newaxis,:, :], 100, axis=0) # expand over the theta-            axis

ax.plot_surface(X, Y,Z, facecolors = col1, shade = True,edgecolors = "None",        alpha = 0.9, linewidth = 0)
ax.view_init(15,-40)

plt.show()
解決方法は?
でカラーマップを作成する場合
LinearSegmentedColormap.from_list
この場合、値は色の相対的な位置に対応します。値の範囲は
0
から
1
ということで、中間色を用意する必要があります。あなたの場合、私はこれを試してみるかもしれません。
cmap = clr.LinearSegmentedColormap.from_list('custom blue',
                                             [(0,    '#ffff00'),
                                              (0.25, '#002266'),
                                              (1,    '#002266')], N=256)
で、納得いくまで色や値を調整します。謝辞は https://stackoverflow.com/a/25000108/5285918
関連
-
Pythonコードの可読性を向上させるツール「pycodestyle」の使い方を詳しく解説します
-
[解決済み】お使いのCPUは、このTensorFlowバイナリが使用するようにコンパイルされていない命令をサポートしています。AVX AVX2
-
[解決済み】DataFrameのコンストラクタが正しく呼び出されない!エラー
-
[解決済み】TypeErrorを取得しました。エントリを持つ子テーブルの後に親テーブルを追加しようとすると、 __init__() missing 1 required positional argument: 'on_delete'
-
[解決済み] プログラムの実行やシステムコマンドの呼び出しはどのように行うのですか?
-
[解決済み] リストのリストからフラットなリストを作るには?
-
[解決済み] Pythonで現在時刻を取得する方法
-
[解決済み] 辞書を値で並べ替えるにはどうしたらいいですか?
-
[解決済み] リストが空かどうかを確認するにはどうすればよいですか?
-
[解決済み】2つの辞書を1つの式でマージする(辞書の和をとる)には?)
最新
-
nginxです。[emerg] 0.0.0.0:80 への bind() に失敗しました (98: アドレスは既に使用中です)
-
htmlページでギリシャ文字を使うには
-
ピュアhtml+cssでの要素読み込み効果
-
純粋なhtml + cssで五輪を実現するサンプルコード
-
ナビゲーションバー・ドロップダウンメニューのHTML+CSSサンプルコード
-
タイピング効果を実現するピュアhtml+css
-
htmlの選択ボックスのプレースホルダー作成に関する質問
-
html css3 伸縮しない 画像表示効果
-
トップナビゲーションバーメニュー作成用HTML+CSS
-
html+css 実装 サイバーパンク風ボタン
おすすめ
-
python call matlab メソッドの詳細
-
Python カメの描画コマンドとその例
-
PythonはWordの読み書きの変更操作を実装している
-
Pythonを使って簡単なzipファイルの解凍パスワードを手作業で解く
-
Python interpreted model libraryによる機械学習モデル出力の可視化 Shap
-
パッケージングツールPyinstallerの使用と落とし穴の回避
-
Python Pillow Image.save jpg画像圧縮問題
-
[解決済み】TypeErrorの修正方法。Unicodeオブジェクトは、ハッシュ化する前にエンコードする必要がある?
-
[解決済み】socket.error: [Errno 48] アドレスはすでに使用中です。
-
[解決済み] 'DataFrame' オブジェクトに 'sort' 属性がない