matplotlib でサブプロットを保存する
2023-11-08 21:42:57
質問
matplotlibの図の中の個々のサブプロットを(pngに)保存することは可能でしょうか?例えば、私が
import pyplot.matplotlib as plt
ax1 = plt.subplot(121)
ax2 = plt.subplot(122)
ax1.plot([1,2,3],[4,5,6])
ax2.plot([3,4,5],[7,8,9])
つのサブプロットをそれぞれ別のファイルに保存するか、せめて新しい図に別々にコピーして保存することは可能でしょうか?
私はRHEL 5上でmatplotlibのバージョン1.0.0を使用しています。
どのように解決するのですか?
Eli 氏の言う通り、通常はあまり必要ありませんが、可能な場合もあります。
savefig
は
bbox_inches
引数を取り、図の一部分だけを選択的に画像として保存するために使用します。
以下に簡単な例を示します。
import matplotlib.pyplot as plt
import matplotlib as mpl
import numpy as np
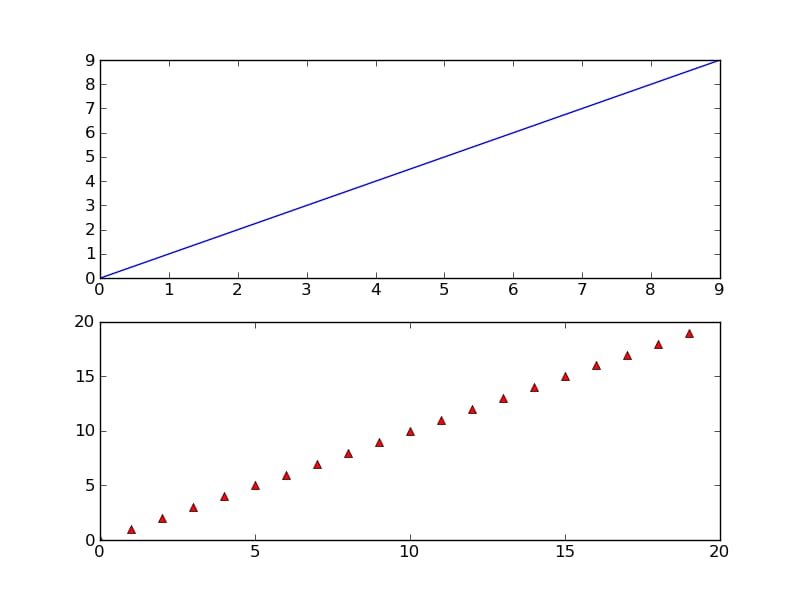
# Make an example plot with two subplots...
fig = plt.figure()
ax1 = fig.add_subplot(2,1,1)
ax1.plot(range(10), 'b-')
ax2 = fig.add_subplot(2,1,2)
ax2.plot(range(20), 'r^')
# Save the full figure...
fig.savefig('full_figure.png')
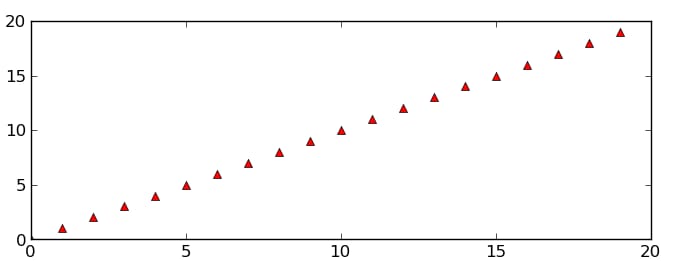
# Save just the portion _inside_ the second axis's boundaries
extent = ax2.get_window_extent().transformed(fig.dpi_scale_trans.inverted())
fig.savefig('ax2_figure.png', bbox_inches=extent)
# Pad the saved area by 10% in the x-direction and 20% in the y-direction
fig.savefig('ax2_figure_expanded.png', bbox_inches=extent.expanded(1.1, 1.2))
完全な図です。
エリア
内側
は、2番目のサブプロットです。
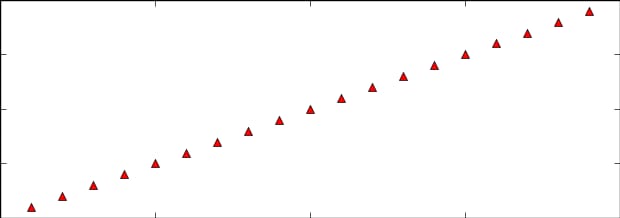
X方向に10%、Y方向に20%パッドされた2番目のサブプロット周辺の領域。
関連
-
[解決済み] Matplotlibでプロットを表示するのではなく、画像ファイルに保存する。
-
[解決済み] IPythonノートブックmatplotlibプロットをインラインで行う方法
-
[解決済み] matplotlib で多数のサブプロットでサブプロットサイズ/スペーシングを改善する
-
[解決済み】Matplotlibで図のタイトルと軸ラベルのフォントサイズを設定するには?
-
[解決済み] Flaskで1時間ごとに関数を実行するようにスケジュールするには?
-
[解決済み] pandasのタイムゾーンに対応したDateTimeIndexを、特定のタイムゾーンに対応したナイーブなタイムスタンプに変換する。
-
[解決済み] Flaskで非同期タスクを作る
-
[解決済み] Pythonで、ウェブサイトが404か200かを確認するためにurllibをどのように使用しますか?
-
[解決済み] Pythonでファイルの読み込みと上書きをする
-
[解決済み] djangoのQueryDictをPythonのDictに変更するには?
最新
-
nginxです。[emerg] 0.0.0.0:80 への bind() に失敗しました (98: アドレスは既に使用中です)
-
htmlページでギリシャ文字を使うには
-
ピュアhtml+cssでの要素読み込み効果
-
純粋なhtml + cssで五輪を実現するサンプルコード
-
ナビゲーションバー・ドロップダウンメニューのHTML+CSSサンプルコード
-
タイピング効果を実現するピュアhtml+css
-
htmlの選択ボックスのプレースホルダー作成に関する質問
-
html css3 伸縮しない 画像表示効果
-
トップナビゲーションバーメニュー作成用HTML+CSS
-
html+css 実装 サイバーパンク風ボタン
おすすめ
-
[解決済み] Django のテストデータベースをメモリ上だけで動作させるには?
-
[解決済み] django.db.migrations.exceptions.InconsistentMigrationHistory
-
[解決済み] 値で列挙名を取得する [重複]。
-
[解決済み] Django で全てのリクエストヘッダを取得するにはどうすれば良いですか?
-
[解決済み] PyQtアプリケーションのスレッド化。QtスレッドとPythonスレッドのどちらを使うか?
-
[解決済み] pycharmがタブをスペースに自動変換する
-
[解決済み] if 節の終了方法
-
[解決済み] virtualenvsはどこに作成するのですか?
-
[解決済み] Pythonの辞書にあるスレッドセーフについて
-
[解決済み] scipy: savefigからフレーム、軸を取り除き、内容のみを表示する。