[解決済み] URLからPNGをダウンロードする LookIntoBitcoin
2022-03-01 09:13:10
質問
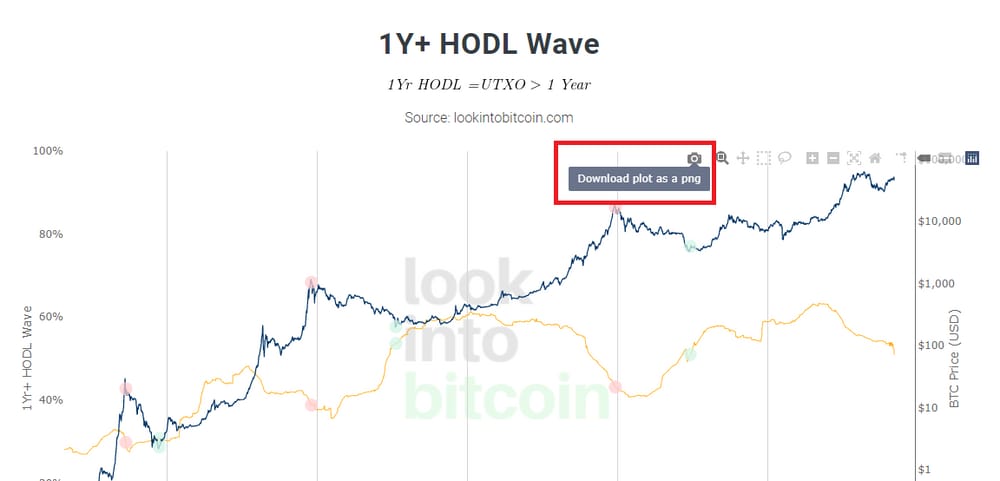
URLのページがあります。 https://www.lookintobitcoin.com/charts/1-year-hodl-wave/
あるページをデザインしていて、このURLの"image"を参照したいだけなんです。 PNGファイルをダウンロードするのですが、このPNG画像ファイルへのパス/urlを取得するにはどうすればよいでしょうか?
ここに画像アイコンがありますが、私はpngファイルへのURLパスだけを取得する方法を見つけ出すことができません。 どなたか、それを取得する方法を教えていただけませんか?
解決方法は?
この画像はクライアント側(ブラウザ)で動的に生成されるため、以下の2つの方法で解決できます。
-
使用方法 セレン または ファントムジェイエス (どちらもヘッドレスブラウザの技術を使っています) を使って、ブラウザの動作をエミュレートし、バックグラウンドで自動的にダウンロードボタンを押すようにします。
-
JSONデータを取得し、自分でグラフを作成する(例 PythonでtxtファイルからPNG画像を作成する方法 )
2番目の方法は、より柔軟性があり、結果画像を広くカスタマイズすることができるため、お勧めです。しかし、ヘッドレスブラウザの方法よりも複雑になる可能性があります。
もし、2番目の方法を使いたいなら、pythonを使用してJSONデータを取得することができます(例)。
import requests
import json

url = 'https://www.lookintobitcoin.com/django_plotly_dash/app/hodl_wave/_dash-update-component'
request_data = {
  "output":"chart.figure",
  "changedPropIds":["url.pathname"],
  "inputs":[
    {
      "id":"url",
      "property":"pathname",
      "value":"/charts/1-year-hodl-wave/"
    }
  ]
}

response = requests.post(url, json=request_data)

print(json.dumps(response.json(), indent=2))
と出力されます。
{
  "response": {
    "props": {
      "figure": {
        "data": [
          {
            "line": {
              "color": "#003366",
              "width": 1.2
            },
            "name": "BTC Price",
            "x": [
              "2010-08-17",
              "2020-09-13",
              "2020-09-14",
              ...
              "2021-09-07",
              "2021-09-08"
            ],
            "y": [
              0.07,
              0.07,
              ...
              46215.0
            ],
            "yaxis": "y2",
            "type": "scatter"
          },
          {
            "connectgaps": true,
            "line": {
              "color": "#ffa500",
              "width": 0.8
            },
            "name": "1Yr+ HODL Wave",
            "x": [
              "2010-08-17",
              ...
              "2021-12-16T00:00:00",
              "2021-12-17T00:00:00"
            ],
            "y": [
              0.28032062150000003,
              0.2807032645,
              ...
              0.5101534705064048,
              0.5090896880670537
            ],
            "yaxis": "y",
            "type": "scatter"
          },
          {
            "hoverinfo": "skip",
            "marker": {
              "color": "rgba(255, 207, 209, 0.75)",
              "size": 15
            },
            "mode": "markers",
            "name": "Price Peak",
            "showlegend": true,
            "x": [
              "2011-06-13"
            ],
            "y": [
              20.11
            ],
            "yaxis": "y2",
            "type": "scatter"
          },
          {
            "hoverinfo": "skip",
            "marker": {
              "color": "rgba(255, 207, 209, 0.75)",
              "size": 15
            },
            "mode": "markers",
            "name": "Price Peak",
            "showlegend": false,
            "x": [
              "2011-06-13"
            ],
            "y": [
              0.2979442568
            ],
            "yaxis": "y",
            "type": "scatter"
          },
          {
            "hoverinfo": "skip",
            "marker": {
              "color": "rgba(255, 207, 209, 0.75)",
              "size": 15
            },
            "mode": "markers",
            "name": "Price Peak",
            "showlegend": false,
            "x": [
              "2013-12-02"
            ],
            "y": [
              1047.9
            ],
            "yaxis": "y2",
            "type": "scatter"
          },
          {
            "hoverinfo": "skip",
            "marker": {
              "color": "rgba(255, 207, 209, 0.75)",
              "size": 15
            },
            "mode": "markers",
            "name": "Price Peak",
            "showlegend": false,
            "x": [
              "2013-12-02"
            ],
            "y": [
              0.3877138953
            ],
            "yaxis": "y",
            "type": "scatter"
          },
          {
            "hoverinfo": "skip",
            "marker": {
              "color": "rgba(255, 207, 209, 0.75)",
              "size": 15
            },
            "mode": "markers",
            "name": "Price Peak",
            "showlegend": false,
            "x": [
              "2017-12-20"
            ],
            "y": [
              16811.3
            ],
            "yaxis": "y2",
            "type": "scatter"
          },
          {
            "hoverinfo": "skip",
            "marker": {
              "color": "rgba(255, 207, 209, 0.75)",
              "size": 15
            },
            "mode": "markers",
            "name": "Price Peak",
            "showlegend": false,
            "x": [
              "2017-12-20"
            ],
            "y": [
              0.43133634880000005
            ],
            "yaxis": "y",
            "type": "scatter"
          },
          {
            "hoverinfo": "skip",
            "marker": {
              "color": "rgba(211, 245, 231, 0.75)",
              "size": 15
            },
            "mode": "markers",
            "name": "Price Bottom",
            "showlegend": false,
            "x": [
              "2011-11-22"
            ],
            "y": [
              2.31
            ],
            "yaxis": "y2",
            "type": "scatter"
          },
          {
            "hoverinfo": "skip",
            "marker": {
              "color": "rgba(211, 245, 231, 0.75)",
              "size": 15
            },
            "mode": "markers",
            "name": "Price Bottom",
            "showlegend": false,
            "x": [
              "2011-11-22"
            ],
            "y": [
              0.3073864328
            ],
            "yaxis": "y",
            "type": "scatter"
          },
          {
            "hoverinfo": "skip",
            "marker": {
              "color": "rgba(211, 245, 231, 0.75)",
              "size": 15
            },
            "mode": "markers",
            "name": "Price Bottom",
            "showlegend": false,
            "x": [
              "2015-01-17"
            ],
            "y": [
              201.75
            ],
            "yaxis": "y2",
            "type": "scatter"
          },
          {
            "hoverinfo": "skip",
            "marker": {
              "color": "rgba(211, 245, 231, 0.75)",
              "size": 15
            },
            "mode": "markers",
            "name": "Price Bottom",
            "showlegend": false,
            "x": [
              "2015-01-17"
            ],
            "y": [
              0.5363931366
            ],
            "yaxis": "y",
            "type": "scatter"
          },
          {
            "hoverinfo": "skip",
            "marker": {
              "color": "rgba(211, 245, 231, 0.75)",
              "size": 15
            },
            "mode": "markers",
            "name": "Price Bottom",
            "showlegend": true,
            "x": [
              "2018-12-20"
            ],
            "y": [
              3983.01
            ],
            "yaxis": "y2",
            "type": "scatter"
          },
          {
            "hoverinfo": "skip",
            "marker": {
              "color": "rgba(211, 245, 231, 0.75)",
              "size": 15
            },
            "mode": "markers",
            "name": "Price Bottom",
            "showlegend": false,
            "x": [
              "2018-12-20"
            ],
            "y": [
              0.5097358173
            ],
            "yaxis": "y",
            "type": "scatter"
          }
        ],
        "layout": {
          "hovermode": "closest",
          "images": [
            {
              "layer": "below",
              "opacity": 0.1,
              "sizex": 0.4,
              "sizey": 0.4,
              "source": "https://www.lookintobitcoin.com/static/img/logo/logo-stacked.png",
              "x": 0.4,
              "xref": "paper",
              "y": 0.75,
              "yref": "paper"
            }
          ],
          "legend": {
            "font": {
              "color": "#696969"
            },
            "orientation": "h",
            "x": 0.1
          },
          "margin": {
            "t": 10
          },
          "uirevision": "False",
          "xaxis": {
            "color": "#696969",
            "gridcolor": "#d3d3d3",
            "hoverformat": "%d-%b-%y",
            "range": [
              "2010-08-17",
              "2021-12-17T00:00:00"
            ],
            "showline": true,
            "showspikes": true,
            "spikecolor": "#696969",
            "spikedash": "solid",
            "spikemode": "toaxis+across",
            "spikethickness": 1
          },
          "yaxis": {
            "color": "#696969",
            "hoverformat": "%",
            "range": [
              0,
              1
            ],
            "showgrid": false,
            "showspikes": true,
            ...
            "spikethickness": 1,
            "tickformat": "%",
            "title": {
              "text": "1Yr+ HODL Wave"
            }
          },
          "yaxis2": {
            "color": "#696969",
            "dtick": 1,
            ...
            "spikethickness": 1,
            "ticktext": [
              "$0.001",
              ...
              "$10,000",
              "$100,000"
            ],
            "tickvals": [
              0.001,
              ...
              100000
            ],
            "title": {
              "text": "BTC Price (USD)"
            },
            "type": "log",
            "zeroline": true
          }
        }
      }
    }
  }
}
関連
-
[解決済み] ブラウザによって異なるURLの最大長とは?
-
[解決済み] リモート Git リポジトリの URI (URL) を変更するには?
-
[解決済み] URI、URL、URNの違いは何ですか?
-
[解決済み] JavaScriptで現在のURLを取得する?
-
[解決済み] ページを再読み込みせずにURLを変更するにはどうすればよいですか?
-
[解決済み] JavaScriptでURLをエンコードする?
-
[解決済み] jQueryで現在のURLを取得する?
-
[解決済み] アプリケーションからAndroidのWebブラウザでURLを開くにはどうすればよいですか?
-
[解決済み] Bitmapオブジェクトに画像を読み込む際にOutOfMemoryが発生する問題
-
[解決済み] Expressを使用してNodeJSサーバーからファイルをダウンロードする
最新
-
nginxです。[emerg] 0.0.0.0:80 への bind() に失敗しました (98: アドレスは既に使用中です)
-
htmlページでギリシャ文字を使うには
-
ピュアhtml+cssでの要素読み込み効果
-
純粋なhtml + cssで五輪を実現するサンプルコード
-
ナビゲーションバー・ドロップダウンメニューのHTML+CSSサンプルコード
-
タイピング効果を実現するピュアhtml+css
-
htmlの選択ボックスのプレースホルダー作成に関する質問
-
html css3 伸縮しない 画像表示効果
-
トップナビゲーションバーメニュー作成用HTML+CSS
-
html+css 実装 サイバーパンク風ボタン
おすすめ
-
[解決済み] 8bit PNGと32bit PNGの違い?
-
[解決済み] Matlabでどのようにimwarp転送ポイント?
-
[解決済み] .swfビューアから画像を抽出する?
-
[解決済み] HAMLを使って、コンテンツに画像を追加するには?
-
[解決済み] Markdownで画像サイズを変更する
-
[解決済み】JPGとJPEGの画像フォーマット比較
-
[解決済み】linuxでコマンドラインから一連の画像をPDFに変換するにはどうすればいいですか?[クローズド]
-
[解決済み】PNG vs. GIF vs. JPEG vs. SVGの異なるユースケースとは?[クローズド]
-
[解決済み] OpenCVで画像の類似性をチェックする
-
[解決済み] Facebookでプレビューとして表示されるWebサイトの画像を設定するにはどうすればよいですか?