PythonでExcelとWordを自動化し、オフィスの自動化を実現
今日、私はいくつかのPythonのオフィスオートメーションの方法を共有します、収集し、学ぶために歓迎し、サポートするように、チャットに歓迎します。
Openpyxl
OpenpyxlはPythonの中で最も多機能なツールモジュールで、Excelとのやりとりを可能にします pip install openpyxl
pip install python-docx は文字通り、公園を散歩するようなものです。これを使うと、すべての現行およびレガシーなエクセルフォーマット、すなわち xlsx と xls を読み書きすることができます。
Openpyxl では、行と列の充填、方程式の実行、2D および 3D チャートの作成、軸とヘッダーのマーク、その他便利な機能の数々を利用できます。最も重要なことは、このパッケージによって、Excel の無数の行と列を反復処理することができ、煩わしい数値計算やプロット作業から解放されることです。
Python-docx
Python-docxパッケージはWordにとってのOpenpyxl、ExcelにとってのPythonです。もしまだドキュメントを見たことがないのであれば、おそらく見るべきでしょう。Pythonを使い始めてから、Python-docxは私が今まで使った中で最も簡単で、最も分かりやすいツールキットの一つだと言っても過言ではありません。
報告書にテキストを挿入したり、表を埋め込んだり、画像をレンダリングしたりするドキュメントを、オーバーヘッドなしで自動的に生成することができる。
では、独自の自動化パイプラインを作成してみましょう。先にAnacondaを起動し、以下のパッケージをインストールします。
pip install openpyxl
pip install python-docx
Microsoft Excelの自動化
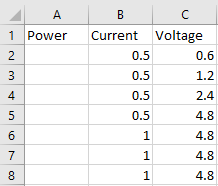
すでに作成されているExcelワークブックを読み込む(下図)。
workbook = xl.load_workbook('Book1.xlsx')
sheet_1 = workbook['Sheet1']
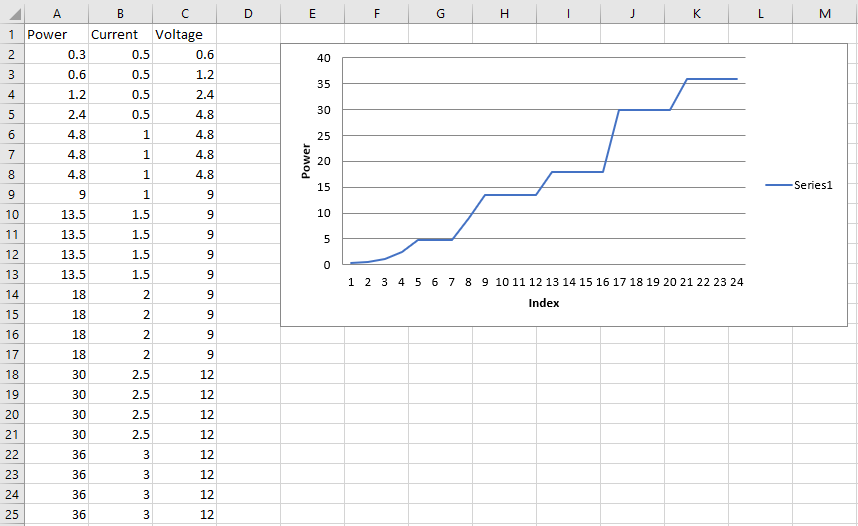
スプレッドシートのすべての行を繰り返し、電流に電圧を掛けて計算し、電力値を挿入します。
for row in range(2, sheet_1.max_row + 1):
    current = sheet_1.cell(row, 2)
    voltage = sheet_1.cell(row, 3)
    power = float(current.value) * float(voltage.value)
    power_cell = sheet_1.cell(row, 1)
    power_cell.value = power
完成したら、計算された電力値を使って折れ線グラフを生成し、以下のように指定したセルに挿入します。
values = Reference(sheet_1, min_row = 2, max_row = sheet_1.max_row, min_col = 1, max_col = 1)
chart = LineChart()
chart.y_axis.title = 'Power'
chart.x_axis.title = 'Index'
chart.add_data(values)
sheet_1.add_chart(chart, 'e2')
workbook.save('Book1.xlsx')
チャートの抽出
さて、グラフができたので、それを画像として取り出し、Wordのレポートに使用する必要があります。
まず、エクセルファイルの正確な場所と、出力されたチャートの画像の保存場所を宣言します。
input_file = "C:/Users/... /Book1.xlsx"
output_image = "C:/Users/... /chart.png"
次に、以下を使用してスプレッドシートにアクセスします。
operation = win32com.client.Dispatch("Excel.Application")
operation.Visible = 0
operation.DisplayAlerts = 0
workbook_2 = operation.Workbooks.Open(input_file)
sheets_2 = operation.
次に、以下のようにスプレッドシート内のすべてのチャート・オブジェクトを反復処理し、指定した場所に保存することができます。
for x, chart in enumerate(sheet_2.Shapes):
    chart.Copy()
    image = ImageGrab.grabclipboard()
    image.save(output_image, 'png')
    pass
workbook_2.Close(True)
operation.Quit()
マイクロソフト・ワードの自動化
チャート画像の作成が完了したので、次に、フォント、フォントサイズ、書式、ページ構成など、レポートの外観を正確に再現したMicrosoft Word文書(.docx)のテンプレート文書を作成する必要があります。
あとは、表の値や画像などの自動生成コンテンツのプレースホルダーを作成し、以下のような変数名で宣言するだけです。
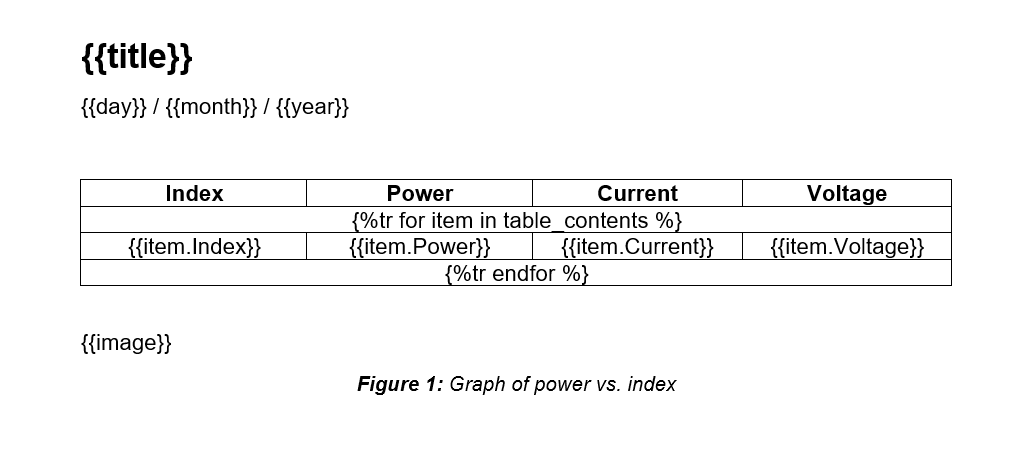
自動化されたコンテンツは、二重中括弧 { で囲むことができる。 <未定義 テキストや画像など、二重中括弧の中で宣言された{variable_name}}を使用します。テーブルの場合は、すべての列を含むテンプレート行を作成し、それを以下の記法で上下の行に付加する必要があります。
{%tr for item in variable_name %}
最終行です。
%tr endfor %}
上の画像では、変数名が
- table_contents テーブルデータを格納するためのPython辞書
- 辞書のキーのインデックス(1列目)
- 辞書値の電力、電流、電圧(2列目、3列目、4列目)
次に、テンプレートドキュメントをPythonにインポートし、テーブルの値を格納する辞書を作成します。
template = DocxTemplate('template.docx')
table_contents = []
for i in range(2, sheet_1.max_row + 1):
    table_contents.append({
        'Index': i-1,
        'Power': sheet_1.cell(i, 1).value,
        'Current': sheet_1.cell(i, 2).value,
        'Voltage': sheet_1.cell(i, 3).value
        })
次に、以前にExcelで生成したチャート画像をインポートし、テンプレート・ドキュメントで宣言されたすべてのプレースホルダー変数をインスタンス化するために、別の辞書を作成することになります。
image = InlineImage(template,'chart.png',Cm(10))
context = {
    'title': 'Automated Report',
    'day': datetime.datetime.now().strftime('%d'),
    'month': datetime.datetime.now().strftime('%b'),
    'year': datetime.datetime.now().strftime('%Y'),
    'table_contents': table_contents,
    'image': image
    }
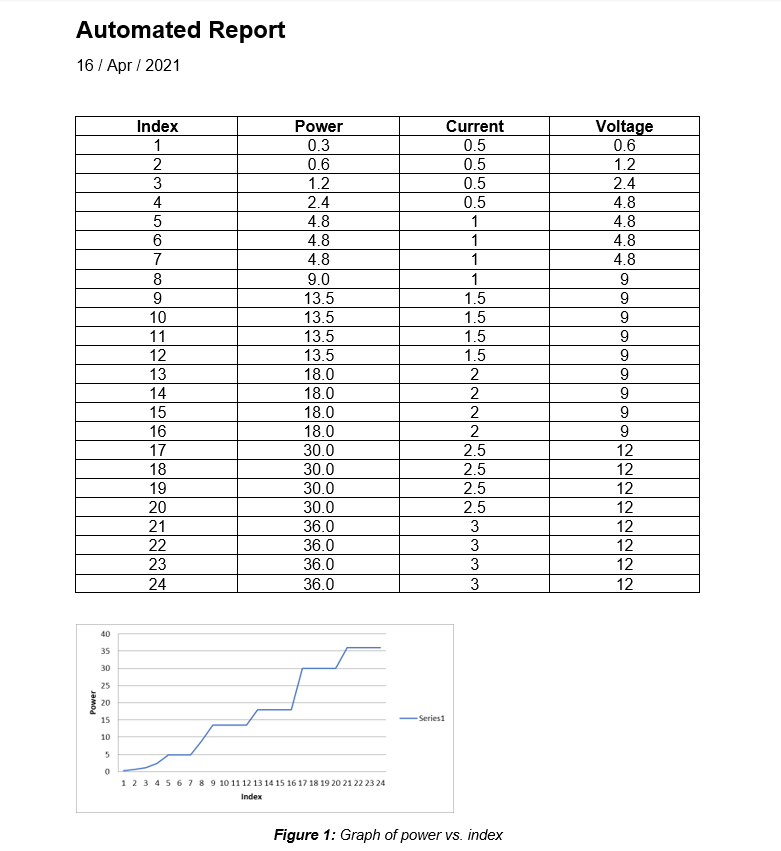
最後に、数値の表とグラフの画像を使用してレポートを表示します。
template.render(context)
template.save('Automated_report.docx')
概要
このように、Microsoft Wordで自動生成された報告書には、Microsoft Excelで作成された数値や図表が含まれています。これで、表、グラフ、文書を必要なだけ作成するための完全自動化パイプラインが完成しました。
ソースコードは以下の通りです。
import openpyxl as xl
from openpyxl.chart import LineChart, Reference

import win32com.client
import PIL
from PIL import ImageGrab, Image
import os
import sys

from docx.shared import Cm
from docxtpl import DocxTemplate, InlineImage
from docx.shared import Cm, Inches, Mm, Emu
import random
import datetime
import matplotlib.pyplot as plt


######## Generate automated excel workbook ########

workbook = xl.load_workbook('Book1.xlsx')
sheet_1 = workbook['Sheet1']

for row in range(2, sheet_1.max_row + 1):
    current = sheet_1.cell(row, 2)
    voltage = sheet_1.cell(row, 3)
    power = float(current.value) * float(voltage.value)
    power_cell = sheet_1.cell(row, 1)
    power_cell.value = power

values = Reference(sheet_1, min_row = 2, max_row = sheet_1.max_row, min_col = 1, max_col = 1)
chart = LineChart()
chart.y_axis.title = 'Power'
chart.x_axis.title = 'Index'
chart.add_data(values)
sheet_1.add_chart(chart, 'e2')

workbook.save('Book1.xlsx')


######## Extract chart image from Excel workbook ########

input_file = "C:/Users/... /Book1.xlsx"
output_image = "C:/Users/... /chart.png" output_image = "C:/Users/... /chart.png"

operation = win32com.client.Dispatch("Excel.Application")
operation.Visible = 0
DisplayAlerts = 0

workbook_2 = operation.Workbooks.Open(input_file)
Sheets(1)

for x, chart in enumerate(sheet_2.Shapes):
    Chart.Copy()
    image = ImageGrab.grabclipboard()
    image.save(output_image, 'png')
    pass

workbook_2.Close(True)
operation.Quit()


######## Generating automated word document ########

template = DocxTemplate('template.docx')

#Generate list of random values
table_contents = []

for i in range(2, sheet_1.max_row + 1):

    table_contents.append({
        'Index': i-1,
        'Power': sheet_1.cell(i, 1).value,
        'Current': sheet_1.cell(i, 2).value,
        'Voltage': sheet_1.cell(i, 3).value
        })

#Import saved figure
image = InlineImage(template,'chart.png',Cm(10))

#Declare template variables
context = {
    'title': 'Automated Report',
    'day': datetime.datetime.now().strftime('%d'),
    'month': datetime.datetime.now().strftime('%b'),
    'year': datetime.datetime.now().strftime('%Y'),
    'table_contents': table_contents,
    'image': image
    }

#Render automated report
template.render(context)
template.save('Automated_report.docx')
データ可視化とPythonについてもっと学びたい方は、Tech Talkグループに参加してください。
テックトーク
転載、ブックマーク、応援などご自由にどうぞ。

これは、自動オフィスを達成するために、ExcelやWordのPythonの自動化に関するこの記事の終わりです、より関連するPythonの自動化オフィスの内容は、スクリプトの家の前の記事を検索してくださいまたは次の関連記事を閲覧し続けるあなたは、将来的に多くのスクリプトハウスをサポートして願っています!.
関連
-
python string splicing.join()とsplitting.split()の説明
-
Weird error 2: TypeError: data type not understood.
-
Pythonスクリプトフレームワークをはじめよう webpyのインストールとアプリケーションの作成
-
[解決済み] Python 3.7 - asyncio.sleep()とtime.sleep()
-
[解決済み] Python 3 - ValueError: アンパックする値が足りない (期待値 3、取得値 2)
-
[解決済み] エラー例外はBaseExceptionから派生する場合でも、派生しなければならない (Python 2.7)
-
[解決済み] djangoのフォームにチェックボックスを挿入する方法
-
[解決済み] tkinterのウィンドウを閉じるにはどうしたらよいですか?
-
Selenium ライブラリ 'list' オブジェクトの python クローラーに属性 'send_keys' がないエラー。
-
Python で matlab データ (.mat ファイル) を読み込む
最新
-
nginxです。[emerg] 0.0.0.0:80 への bind() に失敗しました (98: アドレスは既に使用中です)
-
htmlページでギリシャ文字を使うには
-
ピュアhtml+cssでの要素読み込み効果
-
純粋なhtml + cssで五輪を実現するサンプルコード
-
ナビゲーションバー・ドロップダウンメニューのHTML+CSSサンプルコード
-
タイピング効果を実現するピュアhtml+css
-
htmlの選択ボックスのプレースホルダー作成に関する質問
-
html css3 伸縮しない 画像表示効果
-
トップナビゲーションバーメニュー作成用HTML+CSS
-
html+css 実装 サイバーパンク風ボタン
おすすめ
-
[解決済み】RuntimeWarning: 割り算で無効な値が発生しました。
-
(解決済み) ValueError: 連結軸を除く全ての入力配列の次元が正確に一致する必要がある_walking_quantization-programmer_ITS203
-
RuntimeError: 反復中に辞書のサイズが変更された Solution
-
[解決済み] TypeError: write() の引数は bytes ではなく str でなければならない (Python 3 vs Python 2 )
-
[解決済み] TypeErrorです。str 型は、文字列の分割時にバッファ API をサポートしていません。
-
[解決済み] 文字列の先頭と末尾のゼロを削除するには?Python
-
[解決済み] Pythonで文字列の引き算をする方法
-
[解決済み] ImportError: flask_sqlalchemy' という名前のモジュールがない/2バージョンのPythonがインストールされている
-
[解決済み] なぜtorch.catでPyTorchのテンソルを追加できないのですか?
-
[解決済み] Pythonスクリプトの途中ですべての変数をクリアするにはどうすればよいですか?