各スタックの合計が100%になるようにスケーリングされたスタックバープロットの作成
2023-11-12 17:44:08
質問
このようなdata.frameがあります。
df <- read.csv(text = "ONE,TWO,THREE
                       23,234,324
                       34,534,12
                       56,324,124
                       34,234,124
                       123,534,654")
以下のようなパーセント棒グラフを作りたいのですが(LibreOffice Calcで作りました)。
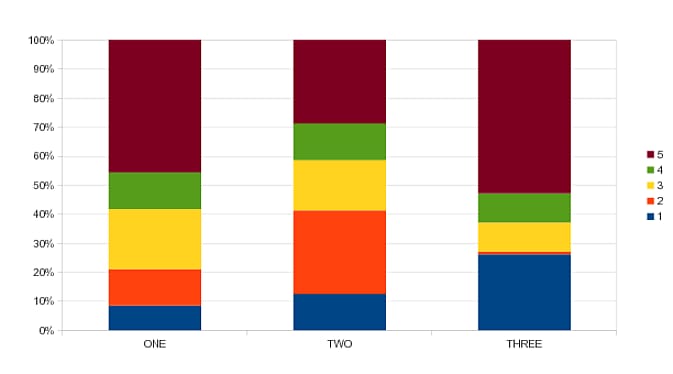
したがって、棒グラフは、すべてのスタックが同じ高さを持ち、合計が 100% になるように標準化される必要があります。今のところ、私が得ることができたのは、積み重ねられた棒グラフ (パーセントではない) だけです。
barplot(as.matrix(df))
何かお手伝いできることはありますか?
どのように解決するのですか?
以下は、それを使った解決方法です。
ggplot
パッケージ (バージョン 3.x) を使用した解決策です。
を使用しています。
position
の引数に
geom_bar
に設定された
position = "fill"
. また
position = position_fill()
の引数を使用したい場合は
position_fill()
(
vjust
と
reverse
).
データは 'wide' 形式であることに注意してください。
ggplot2
では 'long' 形式である必要があることに注意してください。したがって、まず
gather
というデータを作成します。
library(ggplot2)
library(dplyr)
library(tidyr)

dat <- read.table(text = "    ONE TWO THREE
1   23  234 324
2   34  534 12
3   56  324 124
4   34  234 124
5   123 534 654",sep = "",header = TRUE)

# Add an id variable for the filled regions and reshape
datm <- dat %>%
  mutate(ind = factor(row_number())) %>%
  gather(variable, value, -ind)

ggplot(datm, aes(x = variable, y = value, fill = ind)) +
    geom_bar(position = "fill",stat = "identity") +
    # or:
    # geom_bar(position = position_fill(), stat = "identity")
    scale_y_continuous(labels = scales::percent_format())
<イグ
関連
-
R: エラー: $ 演算子は原子ベクトルに対して無効です。
-
R plot.new() のエラー : 図形の余白が大きすぎる
-
データボックス内の行/列の削除/追加を行うR言語
-
R言語 - マトリックス
-
[解決済み] R および RStudio のコンソールをクリアする関数
-
[解決済み] データフレーム内のランダムな行をサンプリングする
-
[解決済み] ベクトル中のある要素のインデックスを求めるR関数はありますか?
-
[解決済み】安定したマッピングを持つggplot2のカテゴリ変数に色を割り当てるには?
-
[解決済み】Rスクリプトで警告をグローバルに抑制する方法
-
[解決済み] FUN内のlapplyインデックス名へのアクセス
最新
-
nginxです。[emerg] 0.0.0.0:80 への bind() に失敗しました (98: アドレスは既に使用中です)
-
htmlページでギリシャ文字を使うには
-
ピュアhtml+cssでの要素読み込み効果
-
純粋なhtml + cssで五輪を実現するサンプルコード
-
ナビゲーションバー・ドロップダウンメニューのHTML+CSSサンプルコード
-
タイピング効果を実現するピュアhtml+css
-
htmlの選択ボックスのプレースホルダー作成に関する質問
-
html css3 伸縮しない 画像表示効果
-
トップナビゲーションバーメニュー作成用HTML+CSS
-
html+css 実装 サイバーパンク風ボタン