ベッセル曲線の軌跡アニメーションのためのCanvasサンプルコード
最近、以下のような効果を実装しましたので、ご紹介します。
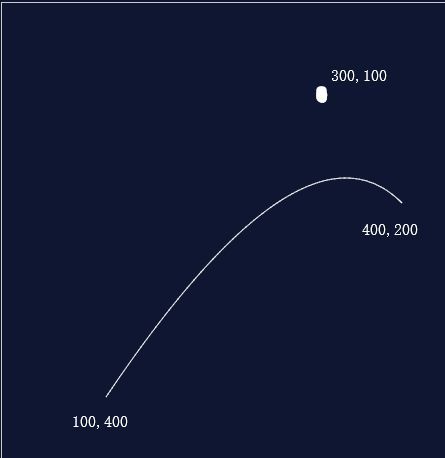
例えば、次のような曲線をアニメーション化したいとします。
その都度、短い線を引いてつなぐと、次のように5分割されます。
<イグ
あと10段落見てください

セグメントの数が十分に多ければ、各セグメントは曲線のように見えるでしょう
二次ベッセル曲線
/**
 * Secondary Bezier curve animation
 * @param {Array<number>} start start point coordinates
 * @param {Array<number>} curvature point coordinates (i.e. the point of the turn, not the exact coordinates, just the general direction)
 * @param {Array<number>} end Coordinates of the end point
 * @param {number} percent plot percentage (0-100)
 */

  function drawCurvePath(start, point, end, percent){
            ctx.beginPath(); // start drawing the line
            ctx.moveTo(start[0], start[1]); //move the brush to the starting point
            for (var t = 0; t <= percent / 100; t += 0.005) {
                //Get the coordinates of each time point
                var x = quadraticBezier(start[0], point[0], end[0], t);
                var y = quadraticBezier(start[1], point[1], end[1], t);
                ctx.lineTo(x, y); // draw a line from the last point in time to the current point in time
            }
             ctx.stroke(); //stroke
        }


/**
 * Quadratic Bessel curve equation
 * @param {Array<number>} start start point
 * @param {Array<number>} curvature point
 * @param {Array<number>} end end point
 * @param {number} plot progress (0-1)
 */
     function quadraticBezier(p0, p1, p2, t) {
            var k = 1 - t;
            return k * k * p0 + 2 * (1 - t) * t * p1 + t * t * p2;
        }
ベジェ曲線の詳細な内容については このブログの記事
フルコードを入れる
<!DOCTYPE html>
<html lang="en">

<head>
    <meta charset="UTF-8">
    <meta name="viewport" content="width=device-width, initial-scale=1.0">
    <meta http-equiv="X-UA-Compatible" content="ie=edge">
    <title>Quadratic Bessel curve animation</title>
    <style>
         body {
            background: #0f1632;
        }

        #canvas {
            border: 1px solid #ccc;
        }
         #img {
            display: none;
            <! --img just hide it, it will be directly referenced later -->
        }

    </style>
</head>

<body>
    <canvas id="canvas" width="1500" height="750"></canvas>
    <img id="img" src="https://s3.imgsha.com/2019/04/22/light.png">

    <script>
        var ctx = document.getElementById('canvas').getContext('2d');
        var img = document.getElementById('img');
        var percent = 0;
        var data = {
                start: [400, 200],
                point: [300, 100],
                end: [100, 400],
                department: 'data1',
                value: 4321
            }

        function init(){
            percent = 0; //reset the process each time
            draw();
        }
        function draw(){
            ctx.clearRect(0, 0, 1500, 750); //clear the canvas each time
            ctx.strokeStyle = '#ffffff'; //set the line style

            drawCurvePath(data.start, data.point, data.end, percent);

            percent += 0.8; //process increase, this controls the animation speed

             if (percent <= 100) { //not finished, call next, reset progress if finished
                requestAnimationFrame(draw);
            }else{
                init()
            }
        }
        function drawCurvePath(start, point, end, percent)
            //...
        }
        function quadraticBezier(p0, p1, p2, t) {
            //...
        }
    </script>
</body>

</html>
アニメーションが出る

前述したように
drawCurvePath(start, point, end, percent)
の関数は
point
このパラメータは、曲率の特定の点ではなく、一般的な方向です

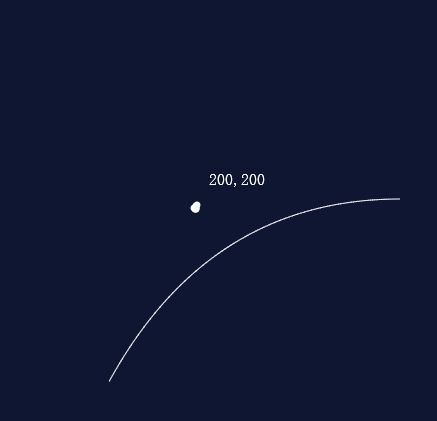
もう一度開くと
point
に変更します。
[200,200]
の場合
<イグ
グラデーションの追加
落下効果を得たい場合は、線の高さから低さへ、遠さから近さへとグラデーションをつける必要があります
/**
 * Create a linear gradient
 * @param {Array<number>} start start point
 * @param {Array<number>} curvature point
 * @param {Array<number>} end end point
 * @param {number} plot progress (0-1)
 */
function createLinearGradient(start,end,startColor,endColor){
  var lineGradient = ctx.createLinearGradient(. . start, . . end);
                lineGradient.addColorStop(0, startColor);
                // lineGradient.addColorStop(0.3, '#fff');
                lineGradient.addColorStop(1, endColor);
  return lineGradient
}
//the draw function needs some tweaking
function draw(){
    //ctx.strokeStyle = '#ffffff';
      ctx.strokeStyle = createLinearGradient(data.start,
                                             data.end,
                                             'rgba(255,255,255,.2)',
                                             '#fff'
                                             );
     //...
}
キャンバスのグラデーションの詳細については MDN
ヘッドヘイロー
頭部に光彩を加えるには、円を描き、放射状のグラデーションを設定します。
drawCurvePath
関数でx,yを取得し、円の位置をリセットします。
function createHeadLight(x,y){
  ctx.beginPath();
  // Create radial gradient
  var radialGradient = ctx.createRadialGradient(x, y, 0, x, y, 20);
        radialGradient.addColorStop(0, "rgba(255,255,255,1)");
        radialGradient.addColorStop(.2, "rgba(255,255,255,.8)");
        radialGradient.addColorStop(1, "transparent");

        ctx.fillStyle = radialGradient;
        // Draw a circle
        ctx.arc(x, y, 20, 0, 2 * Math.PI, false);
        ctx.fill();
}

//the drawCurvePath function needs some tweaking
function drawCurvePath(start, point, end, percent){
        //...
         ctx.stroke(); //stroke
         createHeadLight(x,y) // draws a circle just like the line frequency
    }
円の描画
arc
パラメータの詳細は
MDN
テキストを追加する
テキストの追加は、ヘッダグローの追加と非常に似ており、どちらも
drawCurvePath
関数でx,yを取得し、テキストブロックの位置をリセットします。
/**
 * Create text
 * @param {String} department data
 * @param {Number} data
 * @param {Number} x-axis coordinates
 * @param {Number} y-axis coordinates
 */
function drawText(department, value, x, y) {
            ctx.fillStyle = '#fff'
            ctx.font = "22px 微软雅黑";
            ctx.fillText(department, x + 30, y + 20); // in order to make the text in the lower right corner of the halo x,y axis needs to be offset by some distance
            var width = ctx.measureText(value).width; //Get the width of the text
            ctx.fillStyle = createLinearGradient([x + 30, 0], //Rendering range of the text gradient x-axis is [x + 30, x + 30 + width of the text],
                                                 [x + 30 + width, 0], // here y takes 0, because I didn't find the api to get the text height, write 0 is also possible
                                                 '#fffd00',
                                                 '#ff6d00'
                                                 );
            ctx.fillText(value.toLocaleString(), x + 30, y + 50);

        }

// The drawCurvePath function needs some tweaking
 function drawCurvePath(start, point, end, percent, department, value) {
           //...
           createHeadLight(x,y)
           drawText(department, value, x, y)
        }
アニメーションの最後にテキストと画像を追加する
アニメーション終了後のテキストや画像の追加は、カーブアニメーションの終了後、すぐにキャンバスをクリーンアップする必要があるため、注意が必要です
/**
 * Create image
 * @param {Number} x-axis coordinates
 * @param {Number} y-axis coordinates
 */
function drawImg(x, y) {
        ctx.drawImage(img, x - img.width / 2, y - img.height);
    }

// the draw function needs some tweaking
draw(){
    //...

     if (per cent <= 100) {
                requestAnimationFrame(draw);
            }else{
            ctx.clearRect(0, 0, 1500, 750); //clear the canvas immediately after the curve animation
                drawText(data.department, //render text
                         data.value,
                         data.end[0],
                         data.end[1])
                drawImg(data.end[0], data.end[1]) //render the image
                  setTimeout(function(){ //repaint after 2000ms
                     init()
                  },2000)
            }

}
終了
参考記事 canvasで曲線をアニメーション化する - ベジェ曲線をより深く理解するために
今回は以上ですが、学習のお役に立てれば幸いです。また、Scripting Houseをもっと応援していただければ幸いです。
関連
-
Html5による大画面データビジュアライゼーション開発の実装
-
Html5プロジェクト適応システムダークカラーモードプログラム概要の詳細説明
-
html+cssでメニューバーのスロードロップダウン効果を実現するコード例
-
キャンバス経由でのRGBAフォーマットへの色変換とパフォーマンス問題の解決
-
HTML5 WebGLを用いた医療用物流システム
-
HTML5新フォームコントロールとフォームプロパティのサンプルコード詳細
-
localStorageの有効期限を設定する詳細な方法
-
HTML5によるメッセージ通知の利用(Web Notification)
-
html5 canvas 自動改行でテキストを描画するサンプルコード
-
HTML5新タグの互換性 --> <! --<if lt IE 9><!endif--> の2つの方法があります。
最新
-
nginxです。[emerg] 0.0.0.0:80 への bind() に失敗しました (98: アドレスは既に使用中です)
-
htmlページでギリシャ文字を使うには
-
ピュアhtml+cssでの要素読み込み効果
-
純粋なhtml + cssで五輪を実現するサンプルコード
-
ナビゲーションバー・ドロップダウンメニューのHTML+CSSサンプルコード
-
タイピング効果を実現するピュアhtml+css
-
htmlの選択ボックスのプレースホルダー作成に関する質問
-
html css3 伸縮しない 画像表示効果
-
トップナビゲーションバーメニュー作成用HTML+CSS
-
html+css 実装 サイバーパンク風ボタン
おすすめ
-
amaze uiを使った詳細チュートリアル
-
キャンバスで画像のミラーリングと反転を実現する2つの方法
-
キャンバステキストフィルリニアグラデーション使用詳細説明
-
データストレージの3つの方法、Cookie sessionstorage localstorageの類似点と相違点の分析
-
HTMLメタタグとキーワード
-
html5でtype="range "属性のスライダー機能を実装する。
-
クロスドメイン・モディフィケーション iframeページのコンテンツ詳細
-
ビデオグリーンスクリーンキーイングのキャンバスピクセルポイントマニピュレーション
-
Canvas wave garlandのサンプルコード
-
HTMLでIMGをDIVコンテナのサイズに自動的に適応させる方法