統計図表を実現するHtml5円グラフ描画方法
2022-01-12 20:12:37
Html5には強力な描画APIが用意されており、javascriptを使って様々なグラフを簡単に描画することができます。今回は、主にHTML5を使った円グラフ(統計図表)の描画方法について説明します。まずは円グラフの効果を見てみましょう。
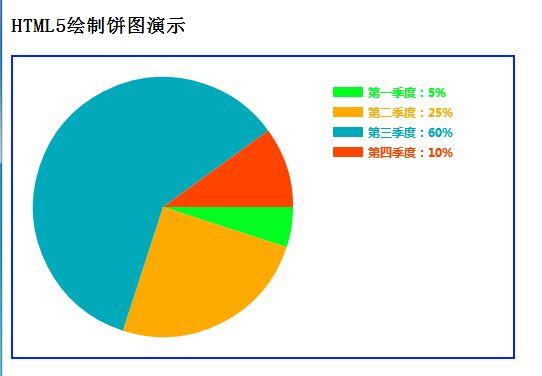
このグラフは、渡されたスケールパラメータ(配列)に基づいて円グラフを動的に描画するように生成されています。円グラフのサイズも <canvas> の高さに基づいて動的に変更されます。
コードの全容は以下の通りです。
<!DOCTYPE html>
<html>
    <head>
        <title>Canvas test</title>
        <meta charset="UTF-8">
        <script>
            //Draw a pie chart
            function drawCircle(canvasId, data_arr, color_arr, text_arr)
            {
                var c = document.getElementById(canvasId);
                var ctx = c.getContext("2d");

                var radius = c.height / 2 - 20; //radius
                var ox = radius + 20, oy = radius + 20; //center of circle

                var width = 30, height = 10; //legend width and height
                var posX = ox * 2 + 20, posY = 30; //
                var textX = posX + width + 5, textY = posY + 10;

                var startAngle = 0; // start radian
                var endAngle = 0; // endAngle
                for (var i = 0; i < data_arr.length; i++)
                {
                    //plot pie chart
                    endAngle = endAngle + data_arr[i] * Math.PI * 2; //endAngle
                    ctx.fillStyle = color_arr[i];
                    ctx.beginPath();
                    ctx.moveTo(ox, oy); //move to the center of the circle
                    ctx.arc(ox, oy, radius, startAngle, endAngle, false);
                    ctx.closePath();
                    ctx.fill();
                    startAngle = endAngle; //set the starting radius

                    //draw the scale map and text
                    ctx.fillStyle = color_arr[i];
                    ctx.fillRect(posX, posY + 20 * i, width, height);
                    ctx.moveTo(posX, posY + 20 * i);
                    ctx.font = 'bold 12px Microsoft Black'; // italic 30 pixel Microsoft Black font
                    ctx.fillStyle = color_arr[i]; //"#000000";
                    var percent = text_arr[i] + "" + 100 * data_arr[i] + "%";
                    ctx.fillText(percent, textX, textY + 20 * i);
                }
            }

            function init() {
                //draw the pie chart
                //scale data and colors
                var data_arr = [0.05, 0.25, 0.6, 0.1];
                var color_arr = ["#00FF21", "#FFAA00", "#00AABB", "#FF4400"];
                var text_arr = ["Q1", "Q2", "Q3", "Q4"];

                drawCircle("canvas_circle", data_arr, color_arr, text_arr);
            }

            //execute the init() function when the page loads
            window.onload = init;
        </script>
    </head>
    <body>
        <h3> HTML5 drawing pie chart demo</h3>
        <p>
            <canvas id="canvas_circle" width="500" height="300" style="border:2px solid #0026ff;" >
                Browser does not support canvas
            </canvas>
        </p>
    </body>
</html>
この機能をそのまま利用し、より美しくしたい場合は、美的な描画を追加することができます。
このコードの最大の柔軟性は、描画パラメータが描画コードから分離されていることと、Canvasコンテナの高さに応じてパイの大きさが自動的に調整されることです。パラメータの受け渡しは以下のように行う。
var data_arr = [0.05, 0.25, 0.6, 0.1]; //scaled data
var color_arr = ["#00FF21", "#FFAA00", "#00AABB", "#FF4400"]; //color
var text_arr = ["Q1", "Q2", "Q3", "Q4"]; //text
//draw the pie chart
drawCircle("canvas_circle", data_arr, color_arr, text_arr);
今回紹介したのはHtml5円グラフの統計図表を実現する描画方法についてですが、もっと関連するHtml5円グラフ統計図表の内容はスクリプトハウスの過去記事を検索するか、以下の関連記事を引き続き閲覧してください、今後もスクリプトハウスを応援してください!。
関連
最新
-
nginxです。[emerg] 0.0.0.0:80 への bind() に失敗しました (98: アドレスは既に使用中です)
-
htmlページでギリシャ文字を使うには
-
ピュアhtml+cssでの要素読み込み効果
-
純粋なhtml + cssで五輪を実現するサンプルコード
-
ナビゲーションバー・ドロップダウンメニューのHTML+CSSサンプルコード
-
タイピング効果を実現するピュアhtml+css
-
htmlの選択ボックスのプレースホルダー作成に関する質問
-
html css3 伸縮しない 画像表示効果
-
トップナビゲーションバーメニュー作成用HTML+CSS
-
html+css 実装 サイバーパンク風ボタン