[解決済み] matplotlibのpyplotの凡例で線の幅を変更する [重複] [重複
2022-02-19 15:03:49
質問
pyplotの凡例に表示されるラインサンプルの太さや幅を変更したいのですが。
凡例内の線状サンプルの線幅は、それらがプロット上で表す線と同じです (従って、もし線が
y1
は
linewidth=7.0
凡例に対応する
y1
ラベルにも
linewidth=7.0
).
凡例の線をプロットの線より太くしたいのですが。
例えば、以下のようなコードで、以下のような画像が生成されます。
import numpy as np
import matplotlib.pyplot as plt

# make some data
x = np.linspace(0, 2*np.pi)

y1 = np.sin(x)
y2 = np.cos(x)

# plot sin(x) and cos(x)
fig = plt.figure()
ax  = fig.add_subplot(111)
ax.plot(x, y1, c='b', label='y1',linewidth=7.0)
ax.plot(x, y2, c='r', label='y2')

leg = plt.legend()
plt.show()
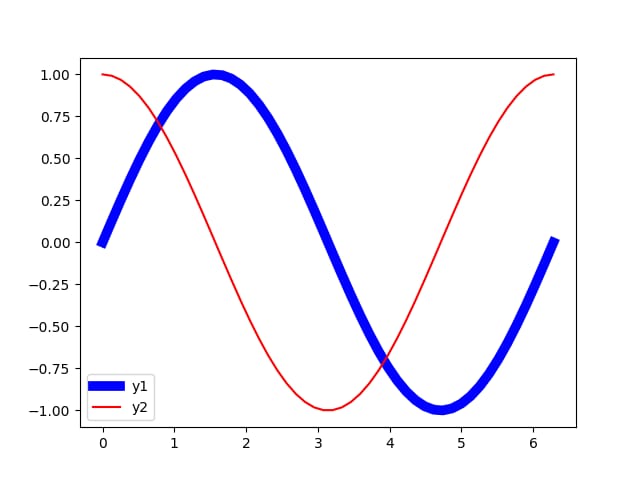
を設定したい。
y1
凡例のラベルに
linewidth=7.0
を使用し、一方
y1
の線が異なる幅で描かれています (
linewidth=1.0
).
ネットで解決策を探してもダメでした。唯一の関連する問題は、凡例のバウンディングボックスの線幅を変更するための答えを持っていた
leg.get_frame().set_linewidth(7.0)
. これは、線の線幅を変更しません。
内の
凡例です。
解決方法は?
凡例ボックス内の線幅を変更するだけなら、@ImportanceOfBeingErnest さんの回答がよいでしょう。しかし、凡例の線幅を変更する前にハンドルをコピーしなければならないので、少し複雑だと思います。また、凡例ラベルのフォントサイズを変更することはできません。次の2つの方法は、線幅を変更するだけでなく、より簡潔な方法で凡例ラベルのテキストのフォントサイズを変更できます。
方法1
import numpy as np
import matplotlib.pyplot as plt

# make some data
x = np.linspace(0, 2*np.pi)

y1 = np.sin(x)
y2 = np.cos(x)

# plot sin(x) and cos(x)
fig = plt.figure()
ax  = fig.add_subplot(111)
ax.plot(x, y1, c='b', label='y1')
ax.plot(x, y2, c='r', label='y2')

leg = plt.legend()
# get the individual lines inside legend and set line width
for line in leg.get_lines():
    line.set_linewidth(4)
# get label texts inside legend and set font size
for text in leg.get_texts():
    text.set_fontsize('x-large')

plt.savefig('leg_example')
plt.show()
方法2
import numpy as np
import matplotlib.pyplot as plt

# make some data
x = np.linspace(0, 2*np.pi)

y1 = np.sin(x)
y2 = np.cos(x)

# plot sin(x) and cos(x)
fig = plt.figure()
ax  = fig.add_subplot(111)
ax.plot(x, y1, c='b', label='y1')
ax.plot(x, y2, c='r', label='y2')

leg = plt.legend()
# get the lines and texts inside legend box
leg_lines = leg.get_lines()
leg_texts = leg.get_texts()
# bulk-set the properties of all lines and texts
plt.setp(leg_lines, linewidth=4)
plt.setp(leg_texts, fontsize='x-large')
plt.savefig('leg_example')
plt.show()
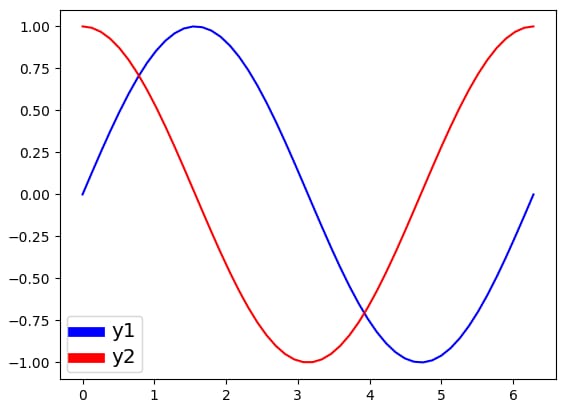
上記の2つの方法は、同じ出力画像を生成します。
関連
-
PythonによるLeNetネットワークモデルの学習と予測
-
python call matlab メソッドの詳細
-
Pythonの@decoratorsについてまとめてみました。
-
[解決済み】お使いのCPUは、このTensorFlowバイナリが使用するようにコンパイルされていない命令をサポートしています。AVX AVX2
-
[解決済み】TypeErrorの修正方法。Unicodeオブジェクトは、ハッシュ化する前にエンコードする必要がある?
-
[解決済み】ImportError: bs4という名前のモジュールがない(BeautifulSoup)
-
[解決済み] matplotlib.pyplotで凡例の大きさを変更する方法
-
[解決済み] なぜ多くの例では Matplotlib/pyplot/python で `fig, ax = plt.subplots()` が使われているのでしょうか?
-
[解決済み] MatplotlibでPyPlotに凡例を追加する最も簡単な方法
-
[解決済み] matplotlib のプロットでフォントサイズを変更する方法
最新
-
nginxです。[emerg] 0.0.0.0:80 への bind() に失敗しました (98: アドレスは既に使用中です)
-
htmlページでギリシャ文字を使うには
-
ピュアhtml+cssでの要素読み込み効果
-
純粋なhtml + cssで五輪を実現するサンプルコード
-
ナビゲーションバー・ドロップダウンメニューのHTML+CSSサンプルコード
-
タイピング効果を実現するピュアhtml+css
-
htmlの選択ボックスのプレースホルダー作成に関する質問
-
html css3 伸縮しない 画像表示効果
-
トップナビゲーションバーメニュー作成用HTML+CSS
-
html+css 実装 サイバーパンク風ボタン
おすすめ
-
PythonによるLeNetネットワークモデルの学習と予測
-
ピローによる動的キャプチャ認識のためのPythonサンプルコード
-
Python 人工知能 人間学習 描画 機械学習モデル作成
-
PythonはWordの読み書きの変更操作を実装している
-
Pythonの画像ファイル処理用ライブラリ「Pillow」(グラフィックの詳細)
-
[解決済み】TypeError: unhashable type: 'numpy.ndarray'.
-
[解決済み] _tkinter.TclError: 表示名がなく、$DISPLAY環境変数もない。
-
[解決済み] builtins.TypeError: strでなければならない、bytesではない
-
[解決済み] 'int'オブジェクトに'__getitem__'属性がない。
-
[解決済み】Python: SyntaxError: キーワードは式になり得ない